MAKE MONEY BLOG$~Gold on Tuesday to continue in a positive trend after gold declined in the previous session because there is no supporting data that support the movement of gold.
Some meetings will be scheduled in the coming days involving German Chancellor Angela Merkel, French President Francois Hollande, Greek Prime Minister Antonis Samaras and President of Europe, Jean-Claude Juncker will be a signal to market actors continued talks with private investors, Troika who will be presenting the official report on the current financial situation in Greece in mid-September.
ECB as the European Central Bank is also planning to introduce a new program for the application of the upper limit of yield spreads bailout recipient. This meant the ECB should intervene to infinite levels, which is tantamount to state financing the periphery of the ECB. So it is not surprising that many investors will seek refuge in the gold market.
Physical gold demand is likely to take place in September, and gave hope to the gold to move up.
After collecting more than 500 tons of gold over the last five years, Russia's central bank raises funds back gold deposits in July was 18.6 tons. Thus, the current total of as much as 936.2 tons of gold deposits, including the standard gold bullion and gold coins, including the ownership of the central bank and the Russian government.
On Monday movement, opened the gold trade in the range of USD 1615.75 per troy ounce, since the opening of the market movement of gold was slightly higher and stuck in the area of strong resistance in the range of USD 1619.80 per troy ounce. Gold fell back sharply and is the lowest price in the range of $ 1609.65 daily per troy ounce. Gold regained some strength and movement in daily highs in the range of USD 1622.30 per troy ounce, and finally closed in the range of USD 1620.25 per troy ounce. The movement of gold posted gains against the dollar as much as USD 4.5.
Spot gold rose to its highest in the last week of U.S. $ 1624.20 per troy ounce. U.S. gold futures contract for December delivery rose 0.2 percent to USD 625.40 per troy ounce.
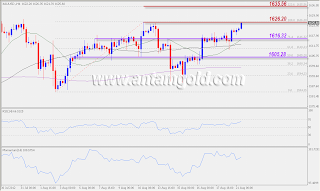
The movement of gold in 4 hour chart's visible indicator is still above the simple moving average (SMA) 50 which is an area of strong support for the movement of gold. Indicator relative strength index (RSI 14) are level 66 to give an indication of prices in a state of minor bullish. While the momentum indicator 14 provides an indication of the minor bullish move.
The movement of gold in 4 hour chart's look back in the bullish bias and is currently testing resistance USD 1626.20 per troy ounce. Rupture resistance is likely to be brought back gold prices move upwards towards the next resistance in the range of USD 1635.56 per troy ounce. Beware if resistant USD 1626.20 per troy ounce survive where there is a possibility of gold prices will again corrected by moving down to the next support in the range of USD 1616.32 per troy ounce.
Fredy Rodo
Senior Consultant & Market Research
Disclaimer
Risk and Disclaimer
Any investment decision should be an individual decision, so the responsibility is on the individual who makes the investment decisions. AntamGold.com not liable for any investment decisions made by any person, whether profit or loss, to the conditions and circumstances whatsoever, resulting directly or indirectly.
source:http://antamgold.com
please give me comments thanks


 5:34 AM
 admin
admin


 Posted in:


0 comments:
Post a Comment