

 11:50 PM
 admin
admin

Dividend income stocks in many cases look a bit overextended. Care should be taken in selecting stocks for dividend income to include reasonable room for price appreciation too.
With that need for extra care in mind, we sought stocks that are reasonably priced in terms of their P/E, earnings growth, yield and dividend growth, volatility, trading liquidity; and which are rated highly for quality and for year ahead total return performance by independent analysts, and that have a yield greater than the S&P 500.
How we got there is detailed below, but these are the 5 stocks that stand out from our analysis today:
1,239 people received this article by email alert
Add your email to get alerts on NOC too:
Get email alerts on NOC »
CVX Chevron
WMT Walmart
LLL L-3 Communications
SNN Smith & Nephew ADR
NOC Northrop Grumman
This is their ThomsonReuters StarMine ratings (0-10) for year ahead performance and yield (explanation of StarMine ratings on our blog)
Symbol StarMine Yield
CVX 9.9 3.1
WMT 9.6 2.4
LLL 8.4 2.7
SNN 8.4 2.9
NOC 8.3 3.0
This is their 10-year dividend payment history:
(click to enlarge)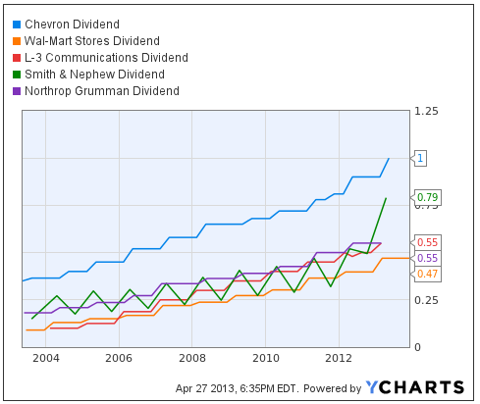
This is their 10-year price history expressed as percentage change:
(click to enlarge)
The Filter Process We Used:
Today, we used GARP and YARP as the foundation of a search for dividend income that may be less likely to be overpriced at this time.
There are variations of GARP (Growth At A Reasonable Price), and we used one of the simplest definitions: trailing P/E divided by the historical 5-year earnings growth rate. The lower the ratio the more "reasonable" the price, all other things being equal.
We made up the term YARP (Yield At A Reasonable Price), and defined it as P/D divided by 5-year dividend growth rate. The lower the ratio the more "reasonable" the price is in terms of yield. P/D is the inverse of yield (a 4% yield is a 25 P/D).
The filter process consisted of reviewing all listed non-ETF stocks to make up each of several lists, then using a proprietary in-house application to find the intersection of all of the lists.
List #1 - GARP: This list consisted of the 50% of all listed stocks that have a GARP ratio that is lower than the median of those that have a positive GARP ratio.
List #2 - YARP: This list consisted of the 50% of all listed stocks that have a YARP ratio that is lower than the median of those that have a positive YARP ratio.
List #3 - Volatility: This list consisted of the 50% of all listed stocks that have a ratio of the 1-year price standard deviation divided by the 1-year moving average that is lower than the median ratio.
List #4 - Trading Liquidity: This list consisted of all listed stocks that have at least a 3-month average $10,000 per minute trading volume.
List #5 - Trendline Slope: This list consisted of all listed stocks where the 1-year and 3-month linear regression best fit trend lines have a positive slope.
We put those five lists into our database tool, to find those stocks that are members of each of the 5 lists.
From that reduced list, we identified those with above average quality ratings from S&P, and if one not found there, then from Wright Investors' Service, which rates a larger universe of stocks.
That brought the list down to 37 stocks from over 6,000 in the full universe.
We then looked up the ThomsonReuters StarMine consensus rating of leading sector analysts for each of those 37 stocks. Of that group more than 60% were rated Very Bullish or Bullish, and only 3 were rated Bearish.
After ranking the stocks by the StarMine rating, we looked up the current yield on each stock and starting with the most highly rated stock moved down the list to identify the first 5 that had a yield greater than 2.1% (better than the S&P 500). That generated the 5 stocks listed above.
Each stock is rated either Very Bullish or Bullish by StarMine. Putting this transparent, objective, rules-based filter together with independent analyst quality ratings and year ahead performance ratings may point to some reasonably good individual stock opportunities -- no guarantees of course.
Disclosure: QVM has positions in CVX and NOC as of the creation date of this article (April 27, 2013). We certify that except as cited herein, this is our work product. We received no compensation or other inducement from any party to produce this article, but are compensated retroactively by Seeking Alpha based on readership of this specific article.
General Disclaimer: This article provides opinions and information, but does not contain recommendations or personal investment advice to any specific person for any particular purpose. Do your own research or obtain suitable personal advice. You are responsible for your own investment decisions. This article is presented subject to our full disclaimer found on the QVM site available here.
This article was sent to 1,239 people who get email alerts on NOC.
Get email alerts on NOC
About this article
Emailed to: 238,405 people who get Dividends & Income daily.
Author payment: $0.01 per page view, with minimum guarantee of $100 for Pro articles and $500 for Alpha-Rich Pro articles plus free access to Seeking Alpha Pro.
Become a contributor »
Tagged: Dividends & Income, Income Investing Strategy
Problem with this article? Please tell us. Disagree with this article? Submit your own.
source
please give me comments thanks
With that need for extra care in mind, we sought stocks that are reasonably priced in terms of their P/E, earnings growth, yield and dividend growth, volatility, trading liquidity; and which are rated highly for quality and for year ahead total return performance by independent analysts, and that have a yield greater than the S&P 500.
How we got there is detailed below, but these are the 5 stocks that stand out from our analysis today:
1,239 people received this article by email alert
Add your email to get alerts on NOC too:
Get email alerts on NOC »
CVX Chevron
WMT Walmart
LLL L-3 Communications
SNN Smith & Nephew ADR
NOC Northrop Grumman
This is their ThomsonReuters StarMine ratings (0-10) for year ahead performance and yield (explanation of StarMine ratings on our blog)
Symbol StarMine Yield
CVX 9.9 3.1
WMT 9.6 2.4
LLL 8.4 2.7
SNN 8.4 2.9
NOC 8.3 3.0
This is their 10-year dividend payment history:
(click to enlarge)

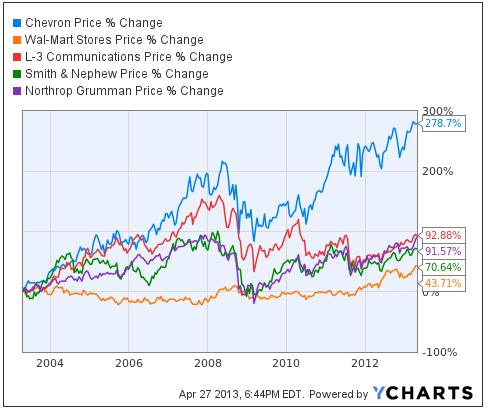
This is their 10-year price history expressed as percentage change:
(click to enlarge)
The Filter Process We Used:
Today, we used GARP and YARP as the foundation of a search for dividend income that may be less likely to be overpriced at this time.
There are variations of GARP (Growth At A Reasonable Price), and we used one of the simplest definitions: trailing P/E divided by the historical 5-year earnings growth rate. The lower the ratio the more "reasonable" the price, all other things being equal.
We made up the term YARP (Yield At A Reasonable Price), and defined it as P/D divided by 5-year dividend growth rate. The lower the ratio the more "reasonable" the price is in terms of yield. P/D is the inverse of yield (a 4% yield is a 25 P/D).
The filter process consisted of reviewing all listed non-ETF stocks to make up each of several lists, then using a proprietary in-house application to find the intersection of all of the lists.
List #1 - GARP: This list consisted of the 50% of all listed stocks that have a GARP ratio that is lower than the median of those that have a positive GARP ratio.
List #2 - YARP: This list consisted of the 50% of all listed stocks that have a YARP ratio that is lower than the median of those that have a positive YARP ratio.
List #3 - Volatility: This list consisted of the 50% of all listed stocks that have a ratio of the 1-year price standard deviation divided by the 1-year moving average that is lower than the median ratio.
List #4 - Trading Liquidity: This list consisted of all listed stocks that have at least a 3-month average $10,000 per minute trading volume.
List #5 - Trendline Slope: This list consisted of all listed stocks where the 1-year and 3-month linear regression best fit trend lines have a positive slope.
We put those five lists into our database tool, to find those stocks that are members of each of the 5 lists.
From that reduced list, we identified those with above average quality ratings from S&P, and if one not found there, then from Wright Investors' Service, which rates a larger universe of stocks.
That brought the list down to 37 stocks from over 6,000 in the full universe.
We then looked up the ThomsonReuters StarMine consensus rating of leading sector analysts for each of those 37 stocks. Of that group more than 60% were rated Very Bullish or Bullish, and only 3 were rated Bearish.
After ranking the stocks by the StarMine rating, we looked up the current yield on each stock and starting with the most highly rated stock moved down the list to identify the first 5 that had a yield greater than 2.1% (better than the S&P 500). That generated the 5 stocks listed above.
Each stock is rated either Very Bullish or Bullish by StarMine. Putting this transparent, objective, rules-based filter together with independent analyst quality ratings and year ahead performance ratings may point to some reasonably good individual stock opportunities -- no guarantees of course.
Disclosure: QVM has positions in CVX and NOC as of the creation date of this article (April 27, 2013). We certify that except as cited herein, this is our work product. We received no compensation or other inducement from any party to produce this article, but are compensated retroactively by Seeking Alpha based on readership of this specific article.
General Disclaimer: This article provides opinions and information, but does not contain recommendations or personal investment advice to any specific person for any particular purpose. Do your own research or obtain suitable personal advice. You are responsible for your own investment decisions. This article is presented subject to our full disclaimer found on the QVM site available here.
This article was sent to 1,239 people who get email alerts on NOC.
Get email alerts on NOC
About this article
Emailed to: 238,405 people who get Dividends & Income daily.
Author payment: $0.01 per page view, with minimum guarantee of $100 for Pro articles and $500 for Alpha-Rich Pro articles plus free access to Seeking Alpha Pro.
Become a contributor »
Tagged: Dividends & Income, Income Investing Strategy
Problem with this article? Please tell us. Disagree with this article? Submit your own.
source
please give me comments thanks


0 comments:
Post a Comment